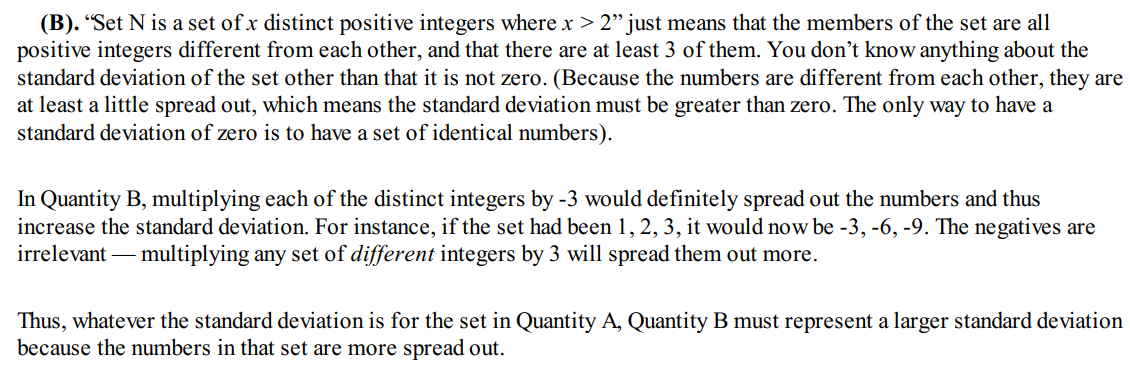
Alright, let’s talk about standard deviation and normal distribution. In this guide, we’re going to break down what Standard Deviation and Normal Distribution are, how they show up in GRE questions, and how you can easily interpret them to help you score big. Plus, we’ll throw in some interactive examples to make things clear. Ready? Let’s dive in!
What’s Standard Deviation, Anyway?
Okay, imagine you're in a room full of people, and you want to know how "spread out" their heights are. If most of the people are roughly the same height, then the difference between their heights (the spread) is small. But if you have a bunch of really tall people and some very short ones, the difference between the heights is larger.

In simple terms, standard deviation is a measure of how much the numbers in a set vary from the mean (average). If the numbers are tightly packed around the mean, the standard deviation is small. If the numbers are spread out far from the mean, the standard deviation is large.
Key Idea:
- Small standard deviation = Numbers are close to the average.
- Large standard deviation = Numbers are more spread out from the average.
Why Does Standard Deviation Matter for the GRE?
You’re probably wondering, “Why should I care about standard deviation for the GRE?” Well, here's the deal: Standard deviation is a popular topic in GRE data interpretation questions. You’ll see it in problems where you need to analyze the spread of data or understand how different data points relate to the mean.
For example, GRE might give you two sets of test scores, both with the same average. But, their standard deviations might be different, telling you how varied or consistent the scores are.
You’ll encounter questions like:
Which data set has the largest standard deviation?
Example: 
What does a high standard deviation tell you about the spread of data?
Example:
:
How does a low standard deviation affect the interpretation of a set of test scores?
Example:
:
These types of questions are common, and if you understand standard deviation, they’ll be a breeze!
How to Calculate Standard Deviation
Now, you might be thinking, “Do I have to memorize complicated formulas for the GRE?” Don’t worry! The GRE typically doesn’t ask you to calculate standard deviation from scratch, but it’s helpful to understand how it’s done.

Here’s a simple breakdown:
Step 1: Find the Mean (Average)
First, add up all the numbers in your set and divide by how many numbers there are.
Example:
Let’s take this small set of numbers:
85, 86, 87, 88, 89
To find the mean:

So, the mean of this set is 87.
Step 2: Find the Differences from the Mean
Now, subtract the mean from each number. This gives you the “difference” from the average for each number.
Example:
- 85−87=−2
- 86−87=−1
- 87−87=0
- 88−87=1
- 89−87=2
Step 3: Square the Differences
Now, square each of the differences to get rid of negative numbers and make the differences bigger if they’re further from the mean.
Example:

Step 4: Find the Variance
Now, find the average of the squared differences. This is the variance.
Example:

Step 5: Find the Standard Deviation
To get the standard deviation, simply take the square root of the variance.

So, the standard deviation for this set of numbers is about 1.41.
Remember, for data interpretation questions on the GRE, you won’t have to go through this full calculation. You’ll be asked to choose the correct interpretation of data, so understanding how the numbers relate to the mean and what they tell you about the spread is the key!
What’s Normal Distribution?
Now, let’s shift gears and talk about normal distribution. You’ve probably heard this term thrown around a lot, especially in statistics. But what exactly is it?
Imagine you’re looking at a bell curve. This curve is symmetrical, with the highest point in the middle and the tails tapering off equally on both sides. This is the normal distribution. It's one of the most common ways data is spread out in the world around us.
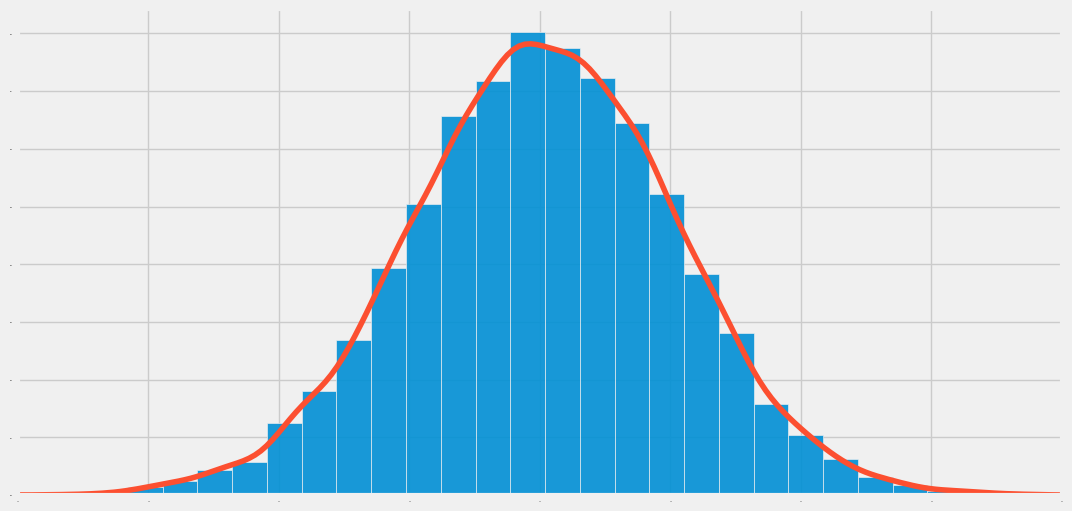
A normal distribution means that most of the data points are clustered around the mean (center), and fewer data points are found as you move further away from the mean. In other words, the majority of people’s heights, test scores, or any other variable will be around the average, with fewer people being extremely short, tall, or scoring way above or below the average.
Key Idea:
- Normal Distribution = Symmetrical, bell-shaped curve
- Mean = Median = Mode: In a perfectly normal distribution, all three measures of central tendency (mean, median, and mode) are the same and sit right at the center of the curve.
- 68% of the data: In a normal distribution, about 68% of the data falls within one standard deviation of the mean.
- 95% of the data: About 95% falls within two standard deviations.
- 99.7% of the data: And about 99.7% of the data falls within three standard deviations.
Key property #1: The standard deviation of a set of numbers is always greater than or equal to 0
Key property #2: If the numbers in a set are all identical, and the standard deviation of that set is zero
So, in a perfectly normal distribution, most of the data is clustered around the mean, with fewer values as you move further away.

Why Does Normal Distribution Matter for the GRE?
Understanding normal distribution is super useful for the GRE, especially for data interpretation questions. A lot of data on the GRE follows a normal distribution, and questions will test your ability to understand the spread of that data.
For example, you might see a set of test scores presented in a bell curve, and the question will ask you how many students scored above a certain value, or what the likely range of scores is for a given percentage of students.
Types of Normal Distribution GRE Questions
You might encounter questions like:
1. What percentage of students scored above the 75th percentile?
Example: Imagine you’re at a spelling bee competition. The average score for the participants is 80, and the standard deviation is 10. Now, you're curious about how many people scored above the 75th percentile. In a normal distribution, the 75th percentile roughly falls one standard deviation above the average, which means scores above 90. Using the properties of normal distribution, you can quickly tell that approximately 25% of the participants scored above that 75th percentile mark (since 75% scored below it). So, if there are 100 students, about 25 students score higher than the 75th percentile. Cool, right?
2. What is the likely range of scores for 95% of students?
Example: Picture this: You're analyzing scores from a baking competition where the average score is 85, and the standard deviation is 5. In a normal distribution, 95% of contestants will fall within two standard deviations from the mean. So, the range will be from 75 to 95 (85 minus 10 to 85 plus 10). This means that most of the bakers scored between 75 and 95. Only about 5% (2.5% on each extreme) would score outside that range. This gives you a quick and easy way to interpret where most contestants' skills fall in the competition.
3. Which data set has a more "normal" distribution?
Example: Now, let’s look at two data sets:
- Data Set A: Scores of 100 students on a marathon race, with a sharp peak around 45 minutes and a long tail stretching out to 2 hours.
- Data Set B: Scores of 100 students in a math test, with a nice symmetrical bell curve, most people clustered around 75, and fewer students scored much higher or lower.
Which data set is more “normal”? It’s Data Set B. The scores in the marathon race in Data Set A show a skewed distribution (with fewer participants finishing extremely slow), which doesn’t fit the symmetrical bell curve. On the other hand, Data Set B, the math test scores, look like the classic normal distribution: a bell-shaped curve where most people performed near the average, and very few did exceptionally well or poorly. So, you can easily say Data Set B follows a more "normal" distribution.
Interpreting Normal Distribution with Real Data
Let’s walk through a simple example of normal distribution:
Example: Test Scores of 1000 Students
Let’s say the average test score of 1000 students is 80, with a standard deviation of 10.
- 68% of students will score between 70 and 90 (within 1 standard deviation of the mean).
- 95% of students will score between 60 and 100 (within 2 standard deviations of the mean).
- 99.7% of students will score between 50 and 110 (within 3 standard deviations of the mean).
Examples
Question 1:

Solution:

Question 2:

Solution:
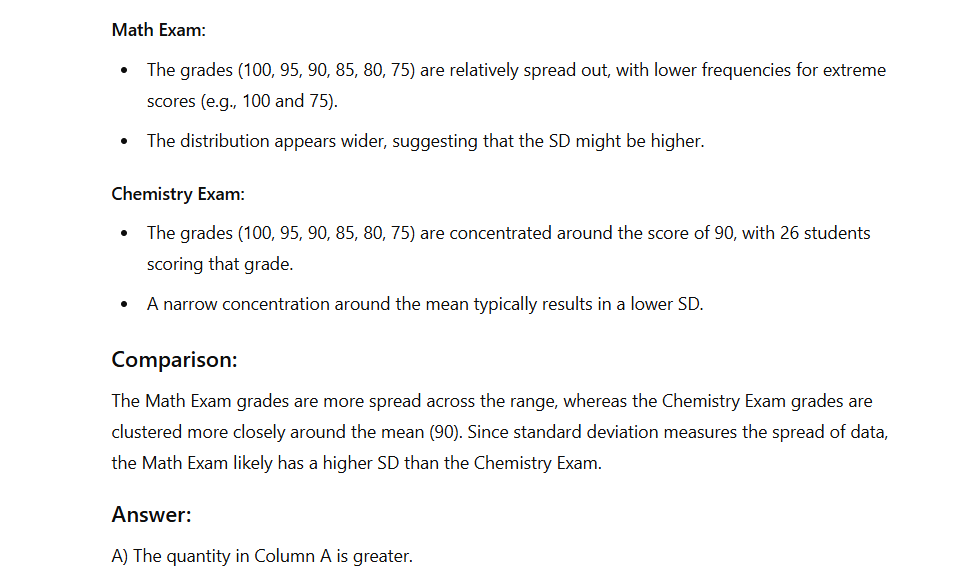
Question 3:

Solution:

Question 4:

Solution:

Question 5:
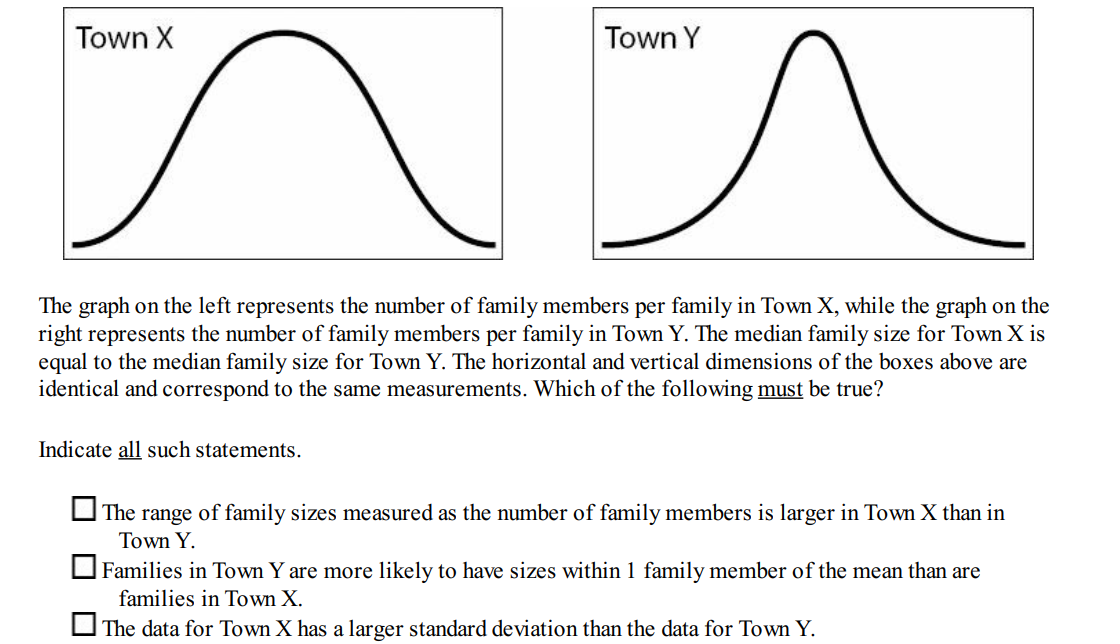
Solution:
Question 6:

Solution:

Question 7:

Solution:

Question 8:
Solution:
Question 9:

Solution:

Question 10:

Solution:
Question 11:

Solution:
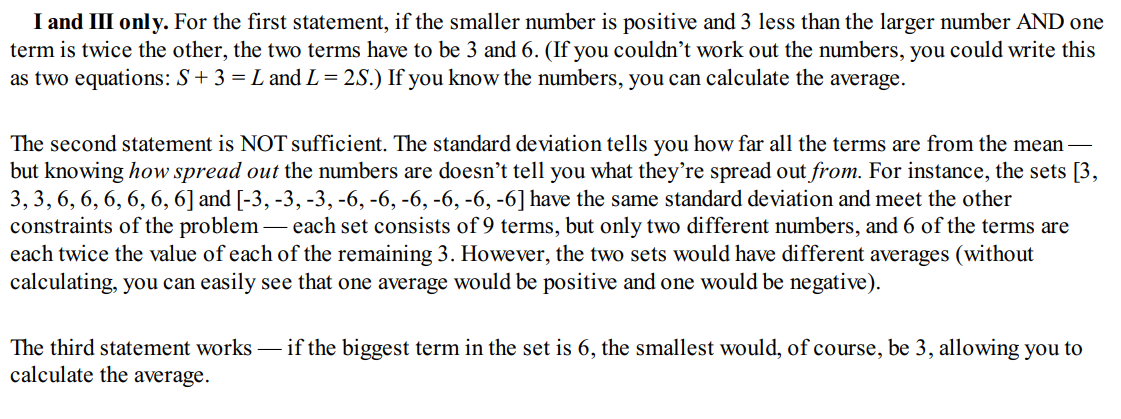
Question 12:

Solution:
